
Alerts Management
You can access the Alerts Management by clicking on the “Alerts” tab on the Server Genius web interface, then on the “Management” menu item. Using the “Create a new Alert” button, you can add alerts on your Server Genius system.
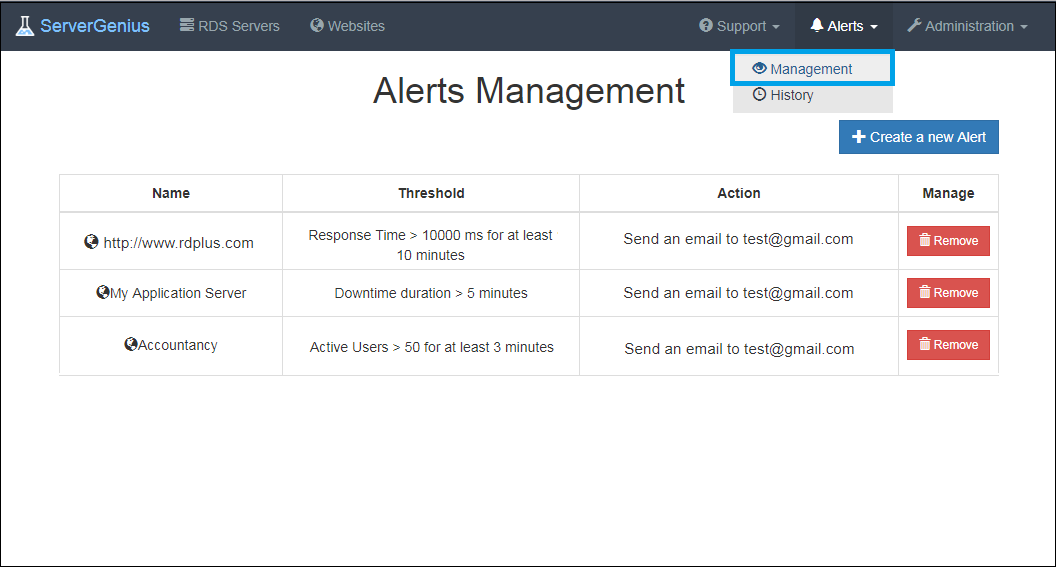
For servers, alerts can be set on:
- Processor
- Memory
- I/O
- Disk used space
- Network Throughput In
- Active Users
- Downtime Duration
You can customize with your own values:
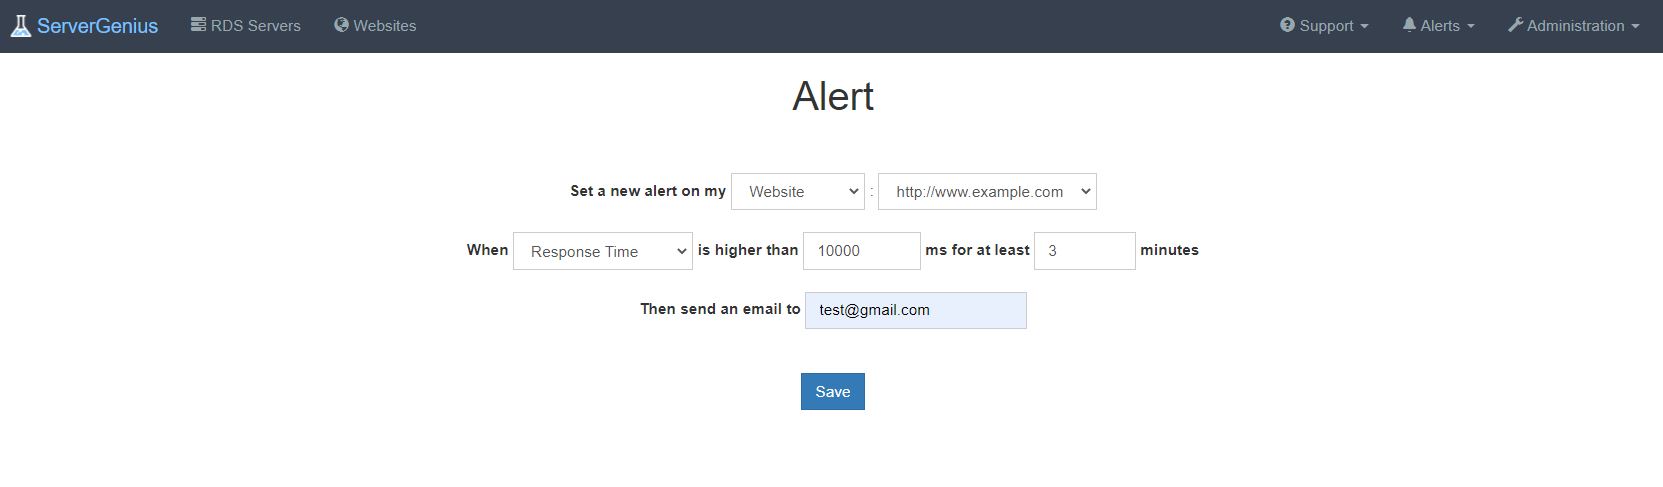
For websites, alerts can be set on Response Time or Downtime Duration.
Once you have configured an alert on your server or your website, Server Genius will closely monitor the chosen metric and send you an email as soon as the targeted threshold is reached or exceeded. Server Genius will of course also send you an email when the metric is back to normal.
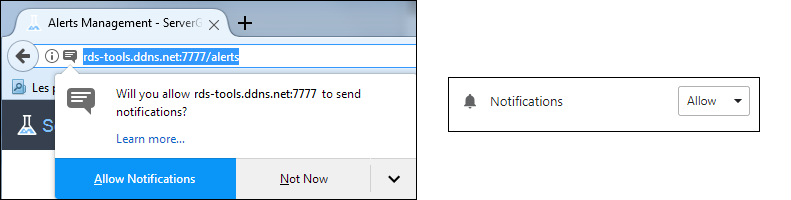
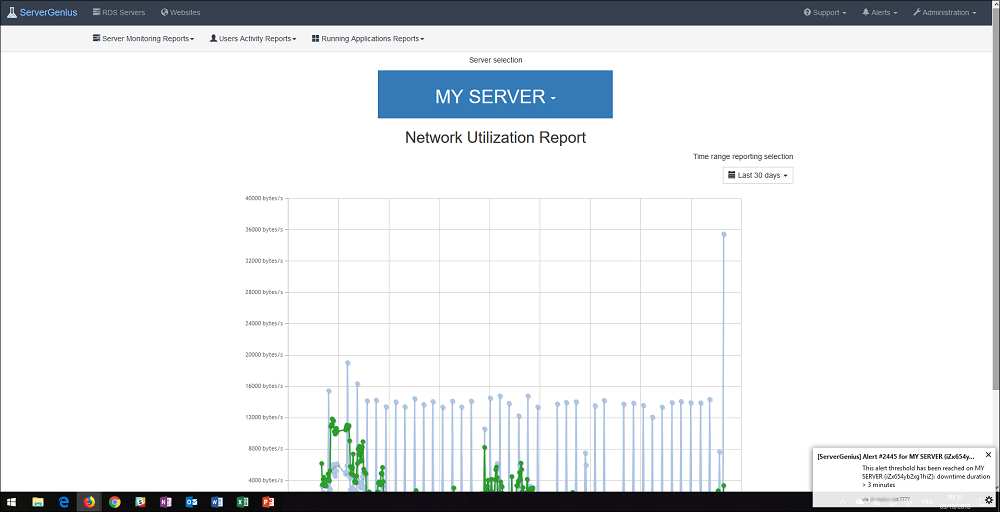
Notifications
Once you have configured an alert on your server or website, ServerGenius will closely monitor the chosen metric and send you an email as soon as the targeted threshold is reached or exceeded. Server Genius will of course also send you an email when the metric is back to normal.
Since Server Genius 3.4 version, it is now possible to enable real-time web notifications by allowing them into your web browser:
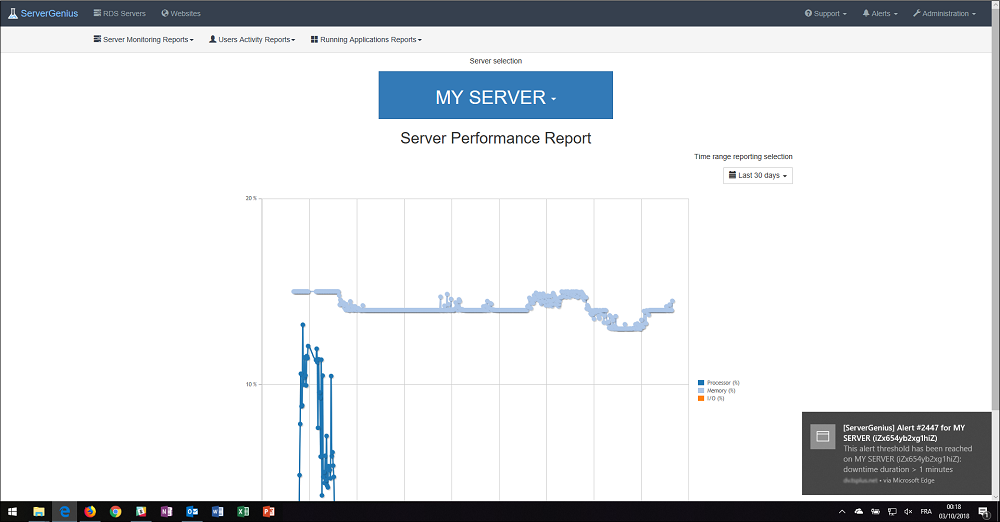
On Microsoft Edge, it enables a Windows native notification display:
On Firefox, Chrome and Opera the web push is displayed at the same location than native notifications:
Finally, you can see a list of active and historic alerts by clicking on the “Alerts” tab on the Server Genius web interface, then on the “History” menu item.