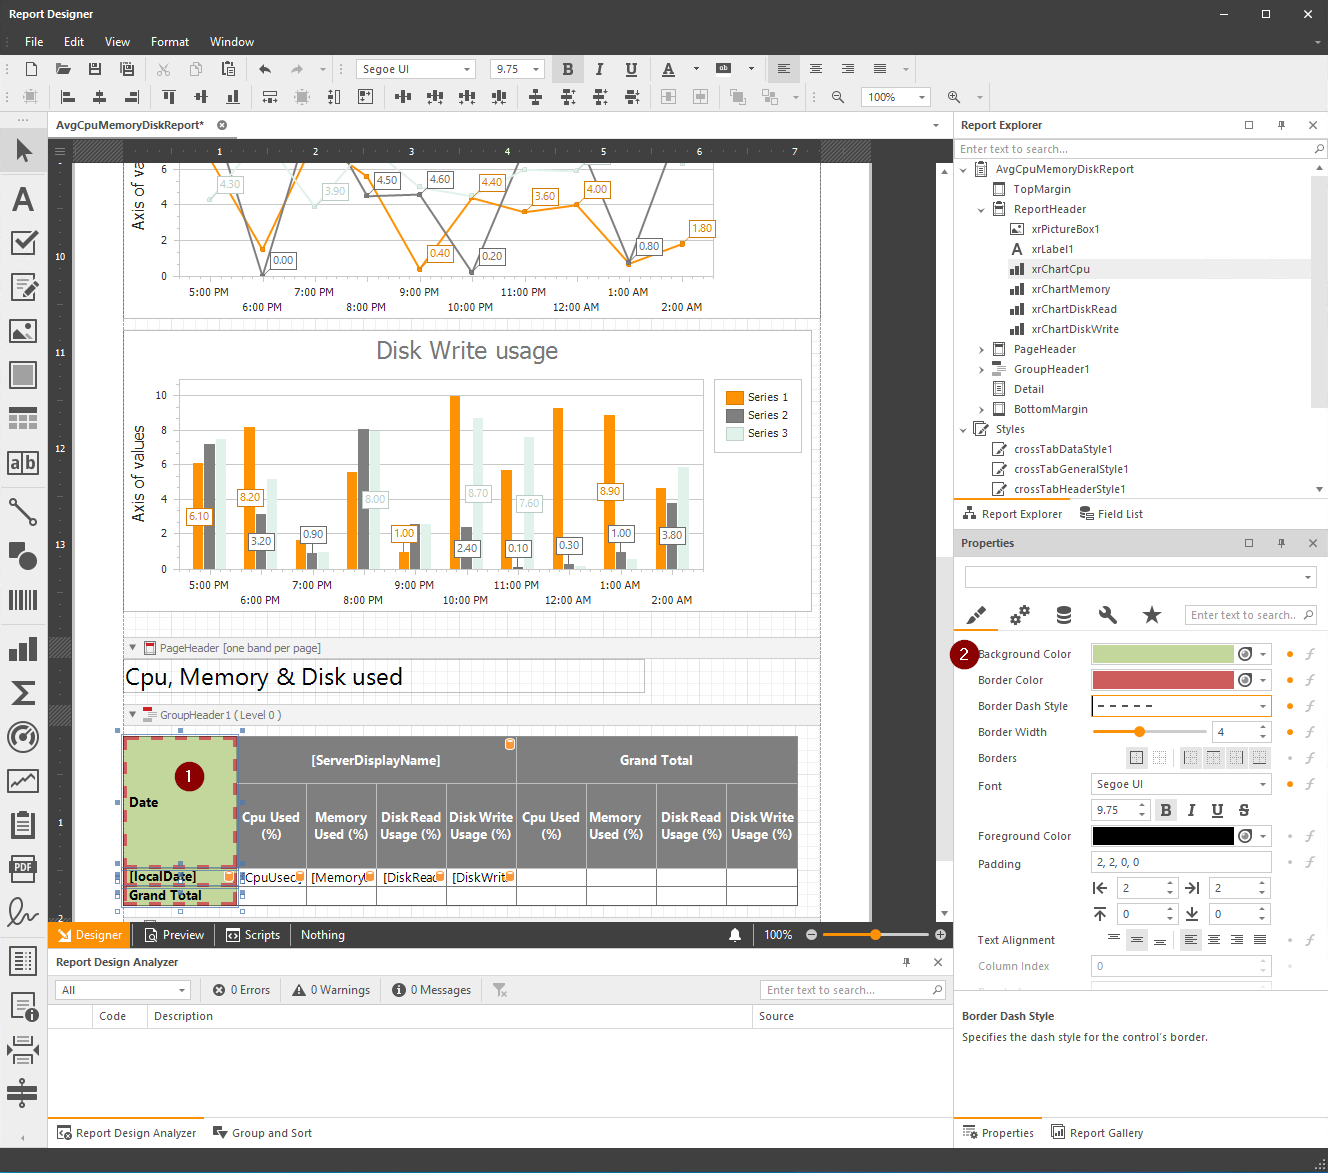
If you want to change the colors of series in a graph:
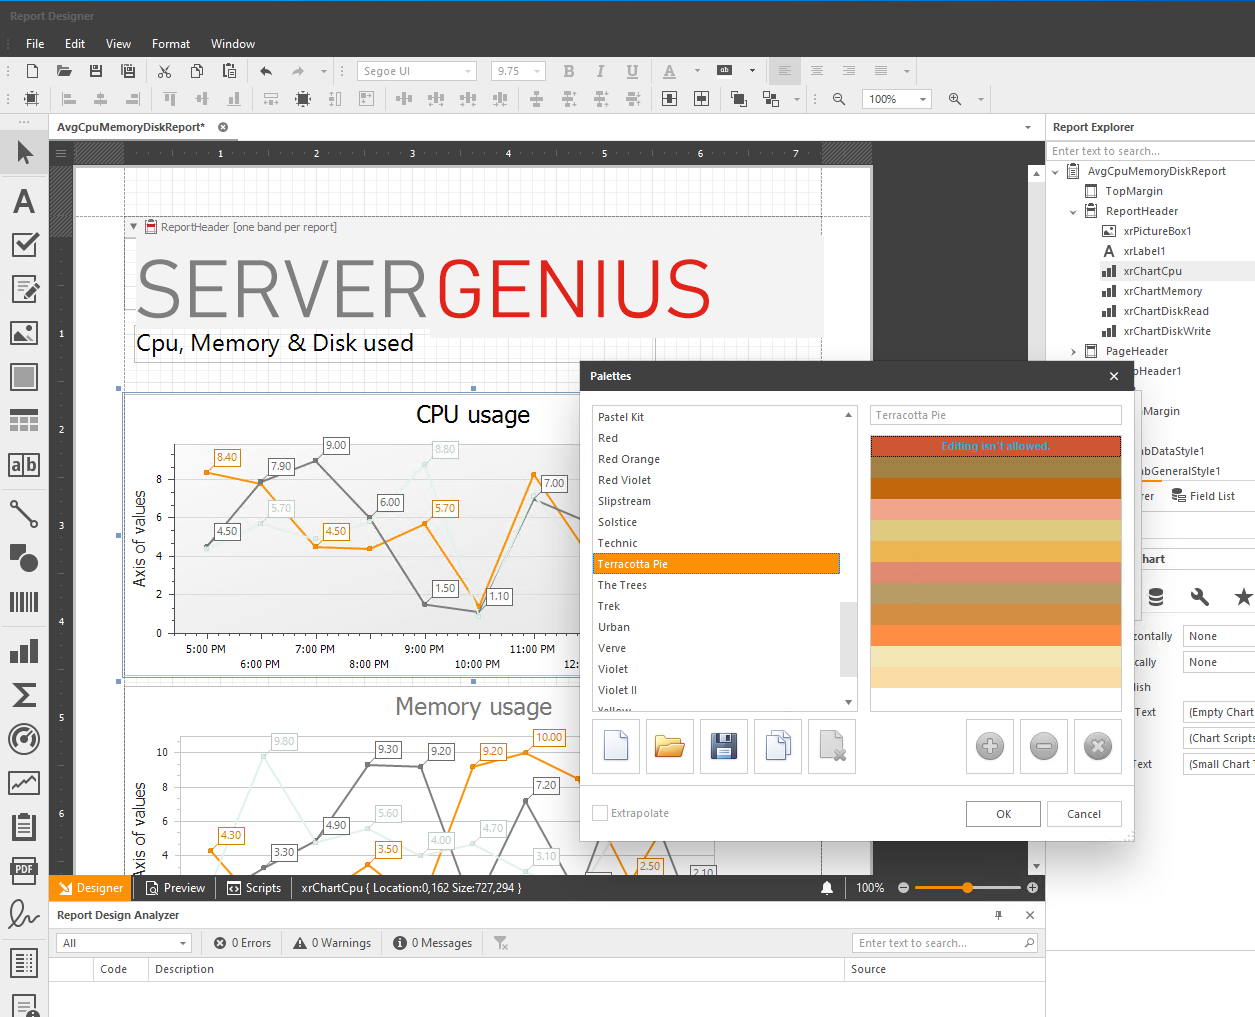
Select the graph you want to change, then click on the settings button, and click on Palettes :
Then choose an existing palette, or create your own:
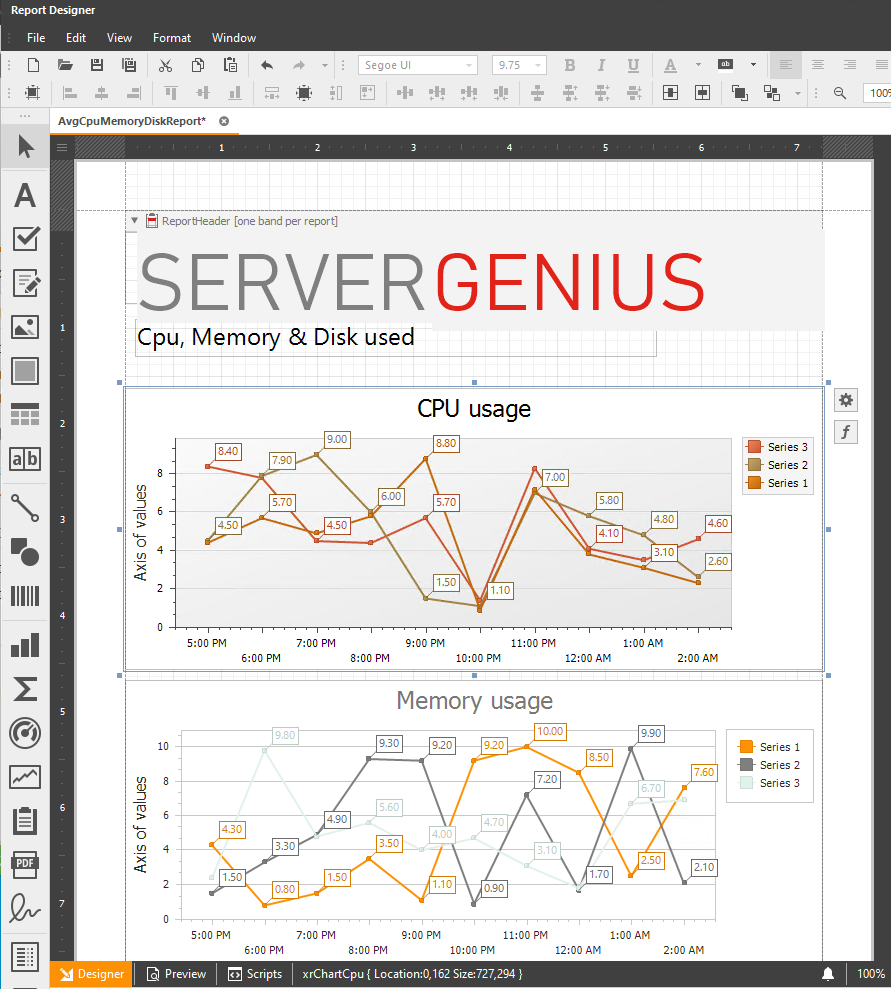
Click on OK, and look at the modifications applied:
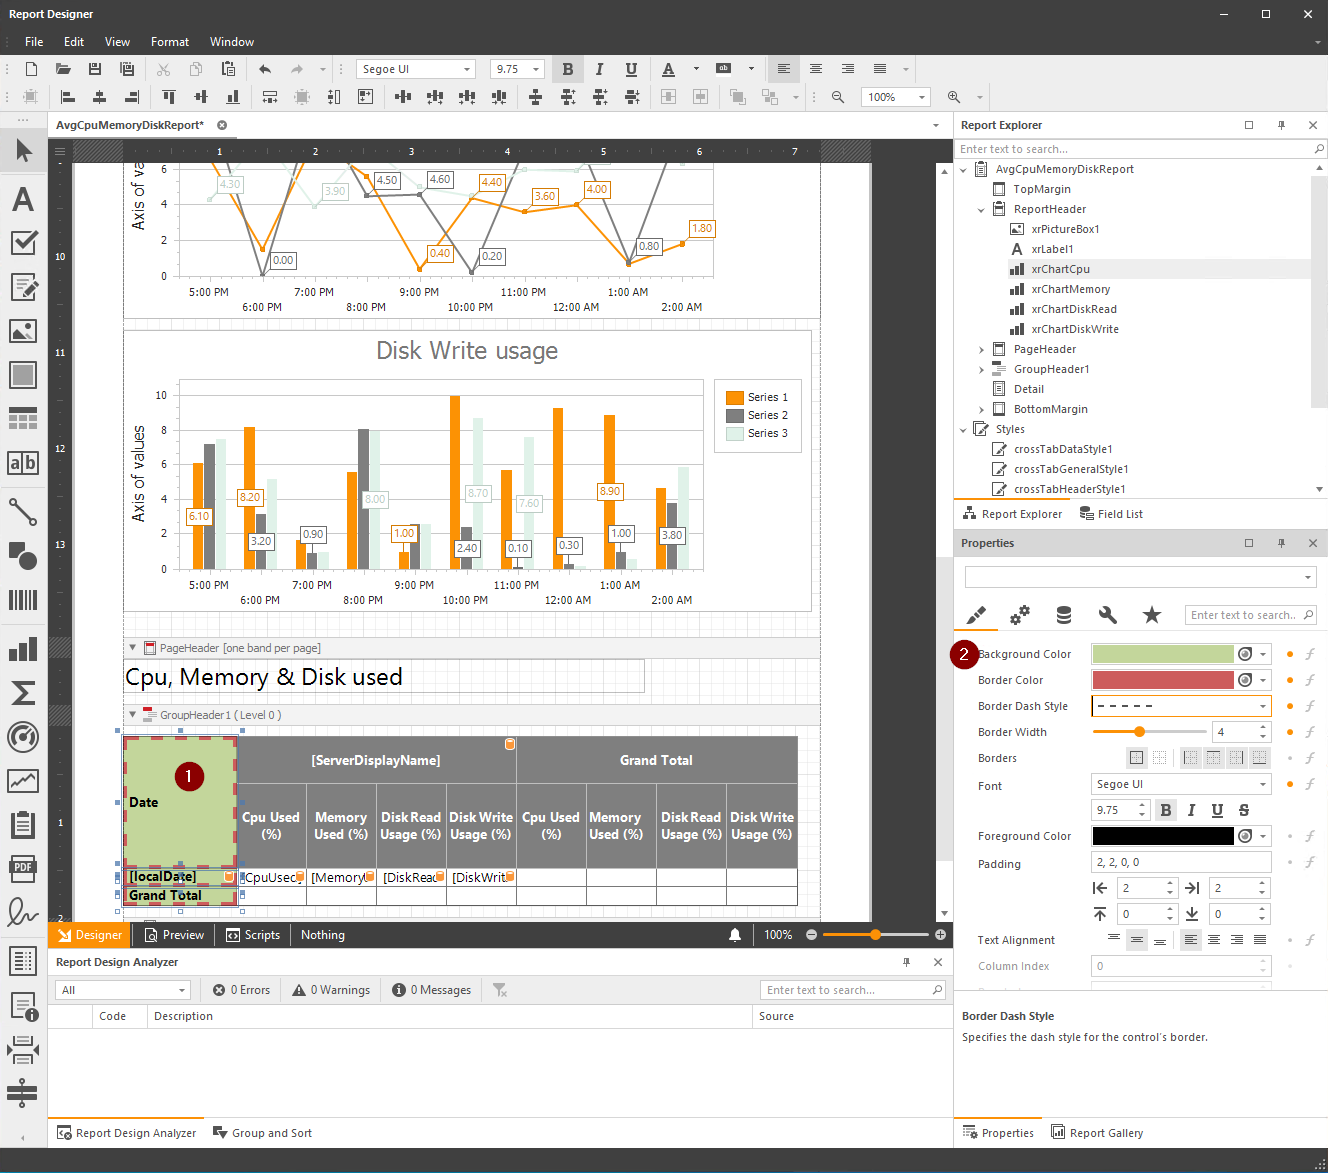
You also can customize datagrid content (colors, borders, fonts, etc.) You just have to select the cell(s) you want to modify, and modify the properties you want: